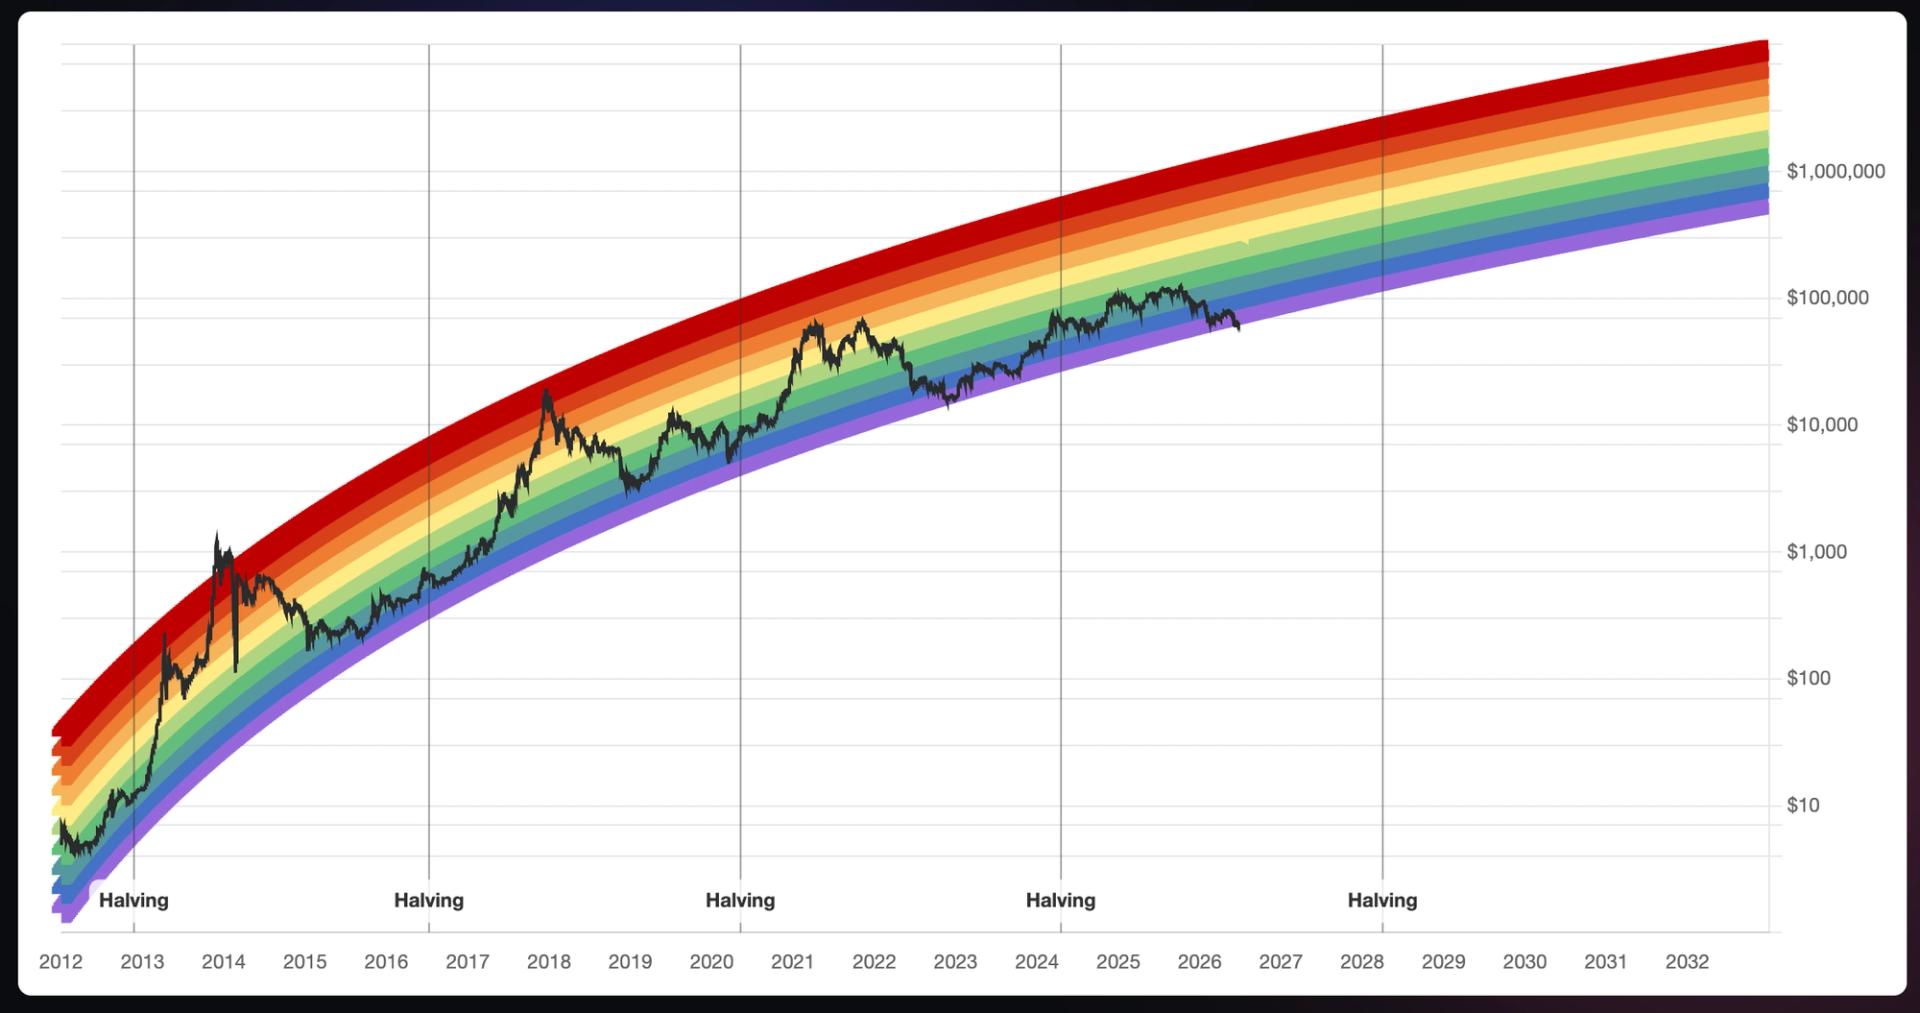
Bitcoin has fallen below the lowest band of the popular Bitcoin Rainbow Chart for the second time in its history, a valuation model that has tracked BTC’s long-term price cycles for more than a decade.
Some of bitcoin's most fervent holders believe the chart is signaling a key buying opportunity. CryptoRover drew comparisons on X Wednesday with the last time it was in this zone of the rainbow in 2022, at $15,000 before a cycle bottom.
Bitcoin trades near $62,500, down roughly 50% from its October 2025 all-time high of $126,000. The decline has pushed BTC below the floor of the modern nine-band Rainbow Chart and into the original model's purple "Bitcoin Is Dead" zone, a level that has historically signaled extreme pessimism rather than a prediction about bitcoin's future.
The move has sparked debate among analysts over whether bitcoin is deeply undervalued or whether the Rainbow Chart itself is becoming less useful as institutional investors, exchange-traded funds (ETFs) and macroeconomic forces play a larger role in the market.
The Rainbow Chart was developed by Reddit user Azop in 2014. It uses a logarithmic growth curve to track bitcoin's long-term price trend and places the asset into colored bands that correspond with different stages of market sentiment.
Analysts disagreed on what the breach means for bitcoin and the Rainbow Chart itself.
"The first time price breaks below a band that has held for over a decade indicates that there's a structural shift in the model,” Markus Levin, co-founder of XYO, told CoinDesk. “I do not read this as bitcoin being dead, I read it as the Rainbow Chart being dead, and that is actually a bullish statement about how far the asset has matured.”
Ryan Lee, Bitget's chief analyst, disagreed. "The Rainbow Chart remains a useful reference for visualizing long-term market cycles, but it should not be viewed as a predictive model," he said.
"The chart is based on logarithmic regression and historical price behavior instead of fundamental, macroeconomic, or market structure variables that increasingly influence bitcoin today,” Lee added.
Emad Shahin, COO of Ethra, said the chart works better as a measure of sentiment than as a forecasting tool.
"The Rainbow Chart is a fitted regression with a sense of humor, not a forecasting tool," Shahin told CoinDesk. "These charts are useful as sentiment cartoons. They capture mood but the moment you treat them as predictive, they fail you at exactly the turning points you most wanted them to call."
Bitcoin peaked at $126,000 in October without reaching the Rainbow Chart's upper red bands. Now, with BTC near $62,500, the price has fallen below the chart's floor.
Source
This article is syndicated for educational reading. For the latest updates, visit the original publisher.
Read on coindesk.com