As bitcoin trades near its 200-week moving average, a long-term support indicator currently sitting around $62,400, investors are closely watching whether the level can hold. If the 200WMA breaks, attention is likely to shift to bitcoin's realized price, currently around $53,457, which has historically acted as the final line of support during major bear markets.
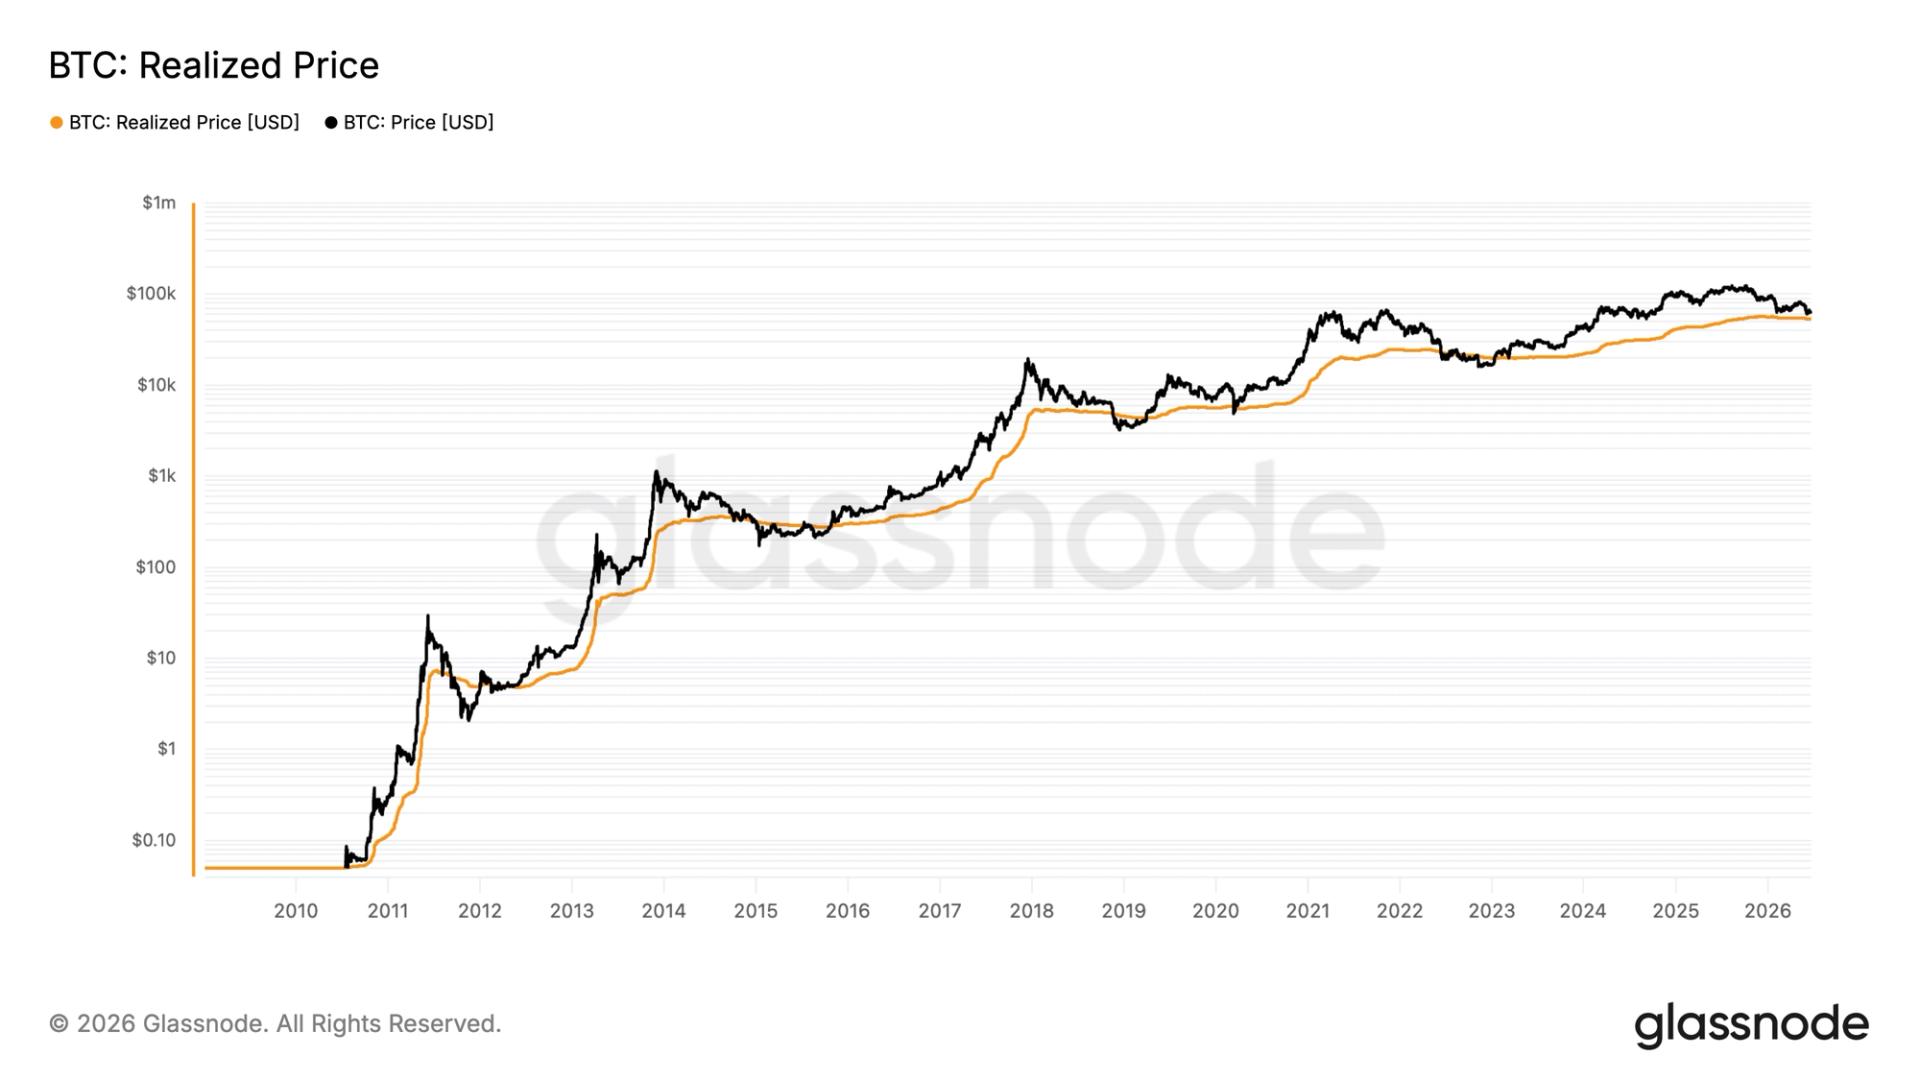
The realized price represents the average on-chain acquisition cost of all bitcoin in circulation and has historically served as a key support level during the depths of bear markets.
In every major bear market cycle, including 2011, 2015, 2018 to 2019, the March 2020 crash, and 2022, bitcoin eventually traded just under its realized price before establishing a cycle bottom. So far, bitcoin has not fallen beneath this level in the current cycle.
From a psychological and sentiment perspective, capitulation tends to occur when investors see the market price fall below their cost basis. Once an asset trades below what investors paid for it, realized losses spread, often leading to panic selling and extreme bearish sentiment. With the realized price near $54,000, it is reasonable to expect increased investor stress if bitcoin falls below that level.
Breaking down realized price by wallet cohort provides additional insight into where support could emerge. Whales holding between 10,000 and 100,000 BTC have a realized price of roughly $54,300, while the largest holders, those with more than 100,000 BTC, have an average cost basis just below $49,000. If large investors are motivated to defend their aggregate cost basis, a bear market low could potentially form somewhere in the $50,000 to $54,000 range.
Meanwhile, retail investors holding less than 1 BTC have a realized price below $48,000, suggesting that smaller holders remain comfortably in profit even if bitcoin declines further.
If history repeats, bitcoin would likely need to trade below the aggregate realized price before a definitive bear market bottom is established.
In May, combined exchange volumes fell 3.45% to $4.41T; the lowest since September 2024. RWA perpetual futures volumes rose 10.4% against the trend, hitting a new all-time high.
In May, combined exchange volumes fell 3.45% to $4.41T; the lowest since September 2024. RWA perpetual futures volumes rose 10.4% against the trend, hitting a new all-time high.
In May, combined exchange volumes fell 3.45% to $4.41T; the lowest since September 2024. RWA perpetual futures volumes rose 10.4% against the trend, hitting a new all-time high.
Source
This article is syndicated for educational reading. For the latest updates, visit the original publisher.
Read on coindesk.com