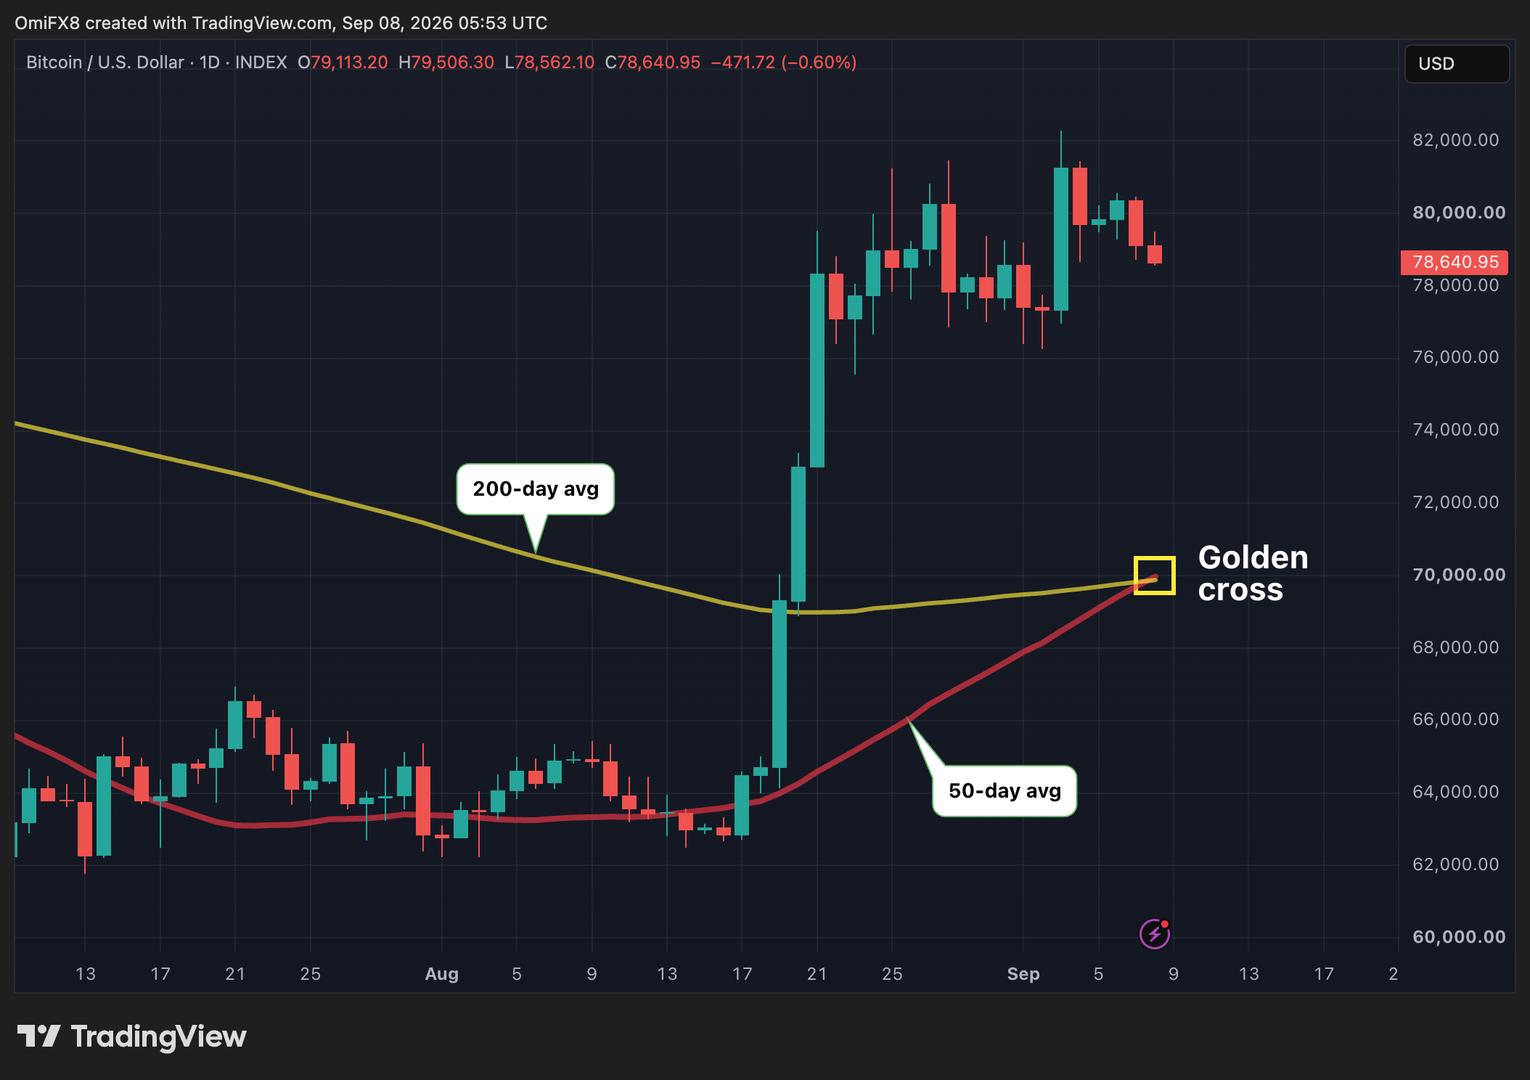
Bitcoin’s BTC$77,937.78 golden cross is live, confirming a widely-tracked bullish signal on the price chart. However, its record as a standalone indicator is mixed.
A golden cross occurs when an assets average price over 50 days, the so-called 50-day simple moving average, moves above its 200-day average. The crossover shows that short‑term momentum is finally overtaking the long‑term trend, setting the stage for a potential sustained rally.
This signal has previously triggered 12 times in bitcoin’s history, yielding a mixed long-term track record, as CoinDesk discussed in detail last week.
Only three out of the 12 historical crosses remained valid for a full year, generating a massive average return of 250% over those 12 months. Across the remaining nine measurable instances where three-month data was available, the signal produced a far more modest three-month average gain of 24.9%.
The latest golden cross, therefore, is far from a guarantee of long-term bullishness, as historical data shows the signal has triggered premature bull traps three times as often as it has sustained multi-year rallies.
As of this writing, bitcoin changed hands at $78,650, down 0.6% since midnight UTC, according to CoinDesk data.
As stablecoins move into regulated finance, APAC is becoming a key proving ground. This report maps the region’s rules, use cases, and RLUSD’s role.
As stablecoins move into regulated finance, APAC is becoming a key proving ground. This report maps the region’s rules, use cases, and RLUSD’s role.
As stablecoins move into regulated finance, APAC is becoming a key proving ground. This report maps the region’s rules, use cases, and RLUSD’s role.
Source
This article is syndicated for educational reading. For the latest updates, visit the original publisher.
Read on coindesk.com