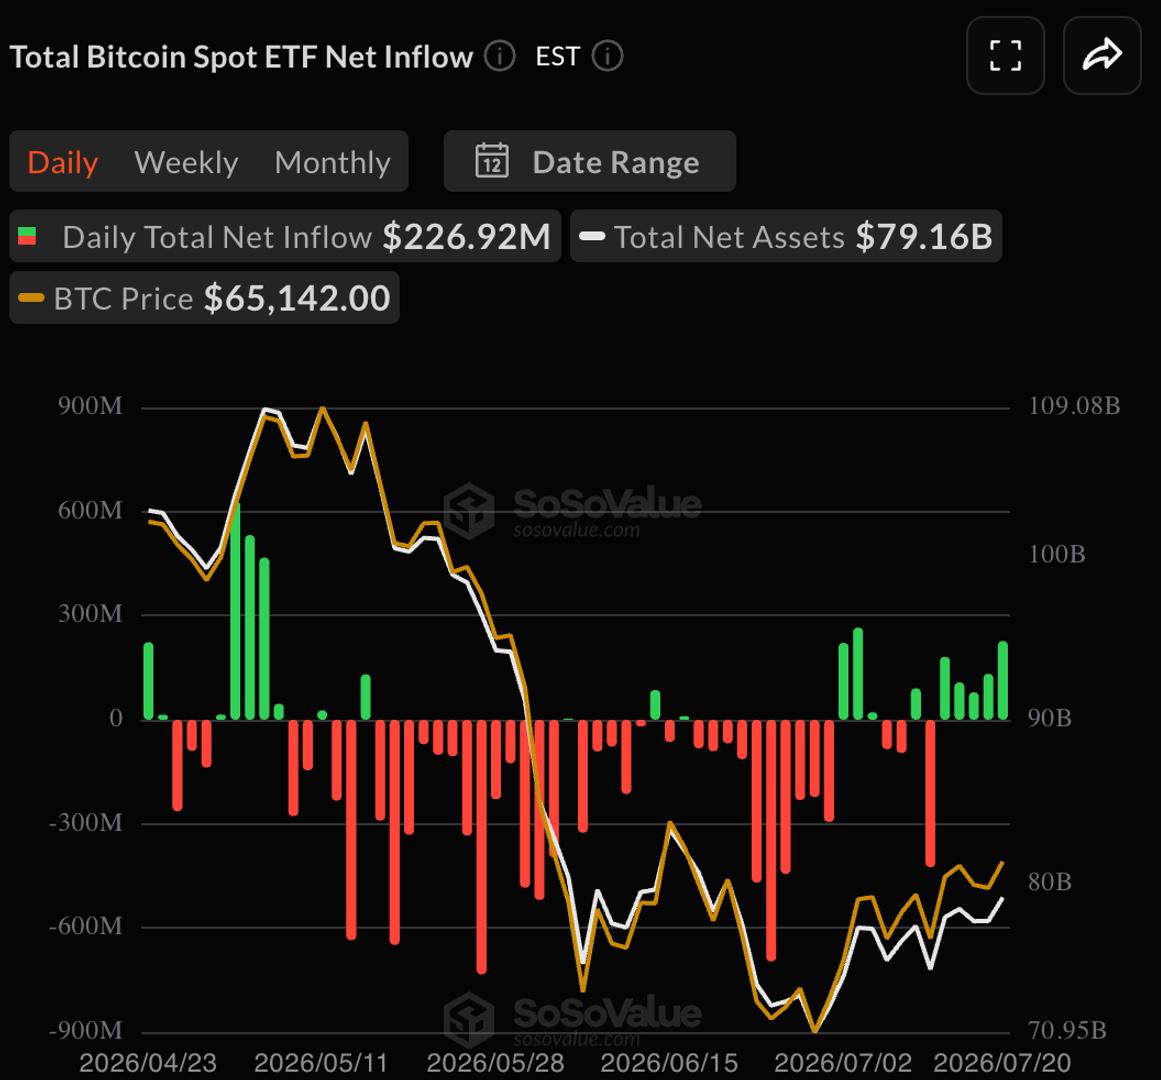
Bitcoin preserved a key long-term trend line as support for a third week as US-Iran war tensions delivered new five-week highs in oil prices.
Bitcoin (BTC) starts the last full week of July holding key support while macro clouds continue to gather.
In a familiar move, Bitcoin saw sell-side pressure soon after the weekly close going into Monday morning, with local lows reaching $63,700, data from TradingView confirms.
BTC/USD one-hour chart. Source: Cointelegraph/TradingView
Despite this, traders are becoming increasingly optimistic on shorter time frames as range lows continue to hold.
“Wouldn’t surprise me if we see some further relief this week - towards 65-67k,” trader Jelle predicted in his latest analysis posted Monday morning on X.
Trader Daan Crypto Trades noted that BTC/USD had sealed its third consecutive weekly close above the 200-week simple moving average (SMA), currently at $63,322.
“To really get this interesting you want to see a strong push higher now to retrace that last leg down and get back above the Weekly 200EMA,” he told X followers, referring to the 200-week exponential moving average (EMA) at $68,521.
BTC/USD one-week chart. Source: Daan Crypto Trades/X
Others doubled down on bullish conviction, with trader Roman again flagging multiple bullish divergences across BTC price metrics, including the relative strength index (RSI), a classic leading indicator.
Contrasting the optimism was seasonality, with BTC price cycle history demanding another year of bear-market moves.
“Bitcoin is more than halfway through its second year in the current BTC Four Year Cycle. 2025 proved to be the year of the $BTC Bull Market peak. And 2026 has proven itself to be the year of the Bitcoin Bear Market,” trader and analyst Rekt Capital summarized.
Source
This article is syndicated for educational reading. For the latest updates, visit the original publisher.
Read on cointelegraph.com